Press resources
Play audio recording of content
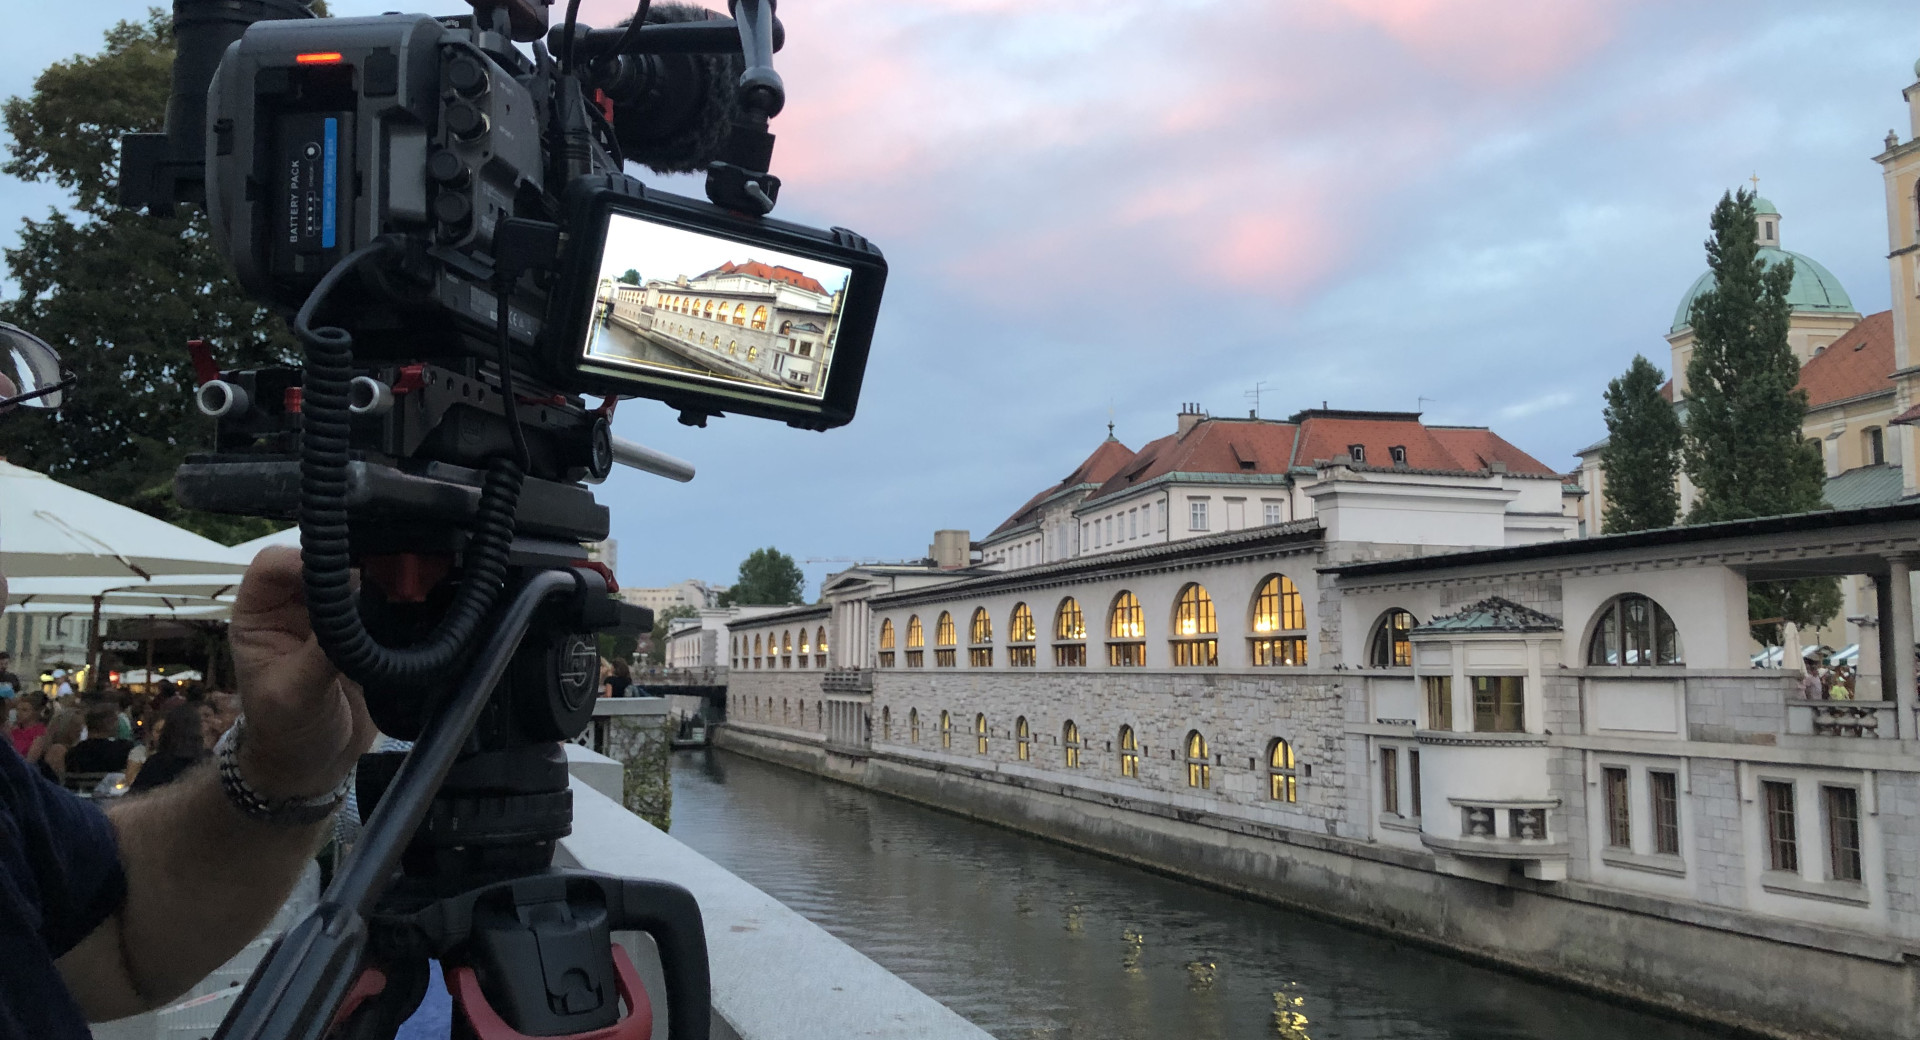
If you are writing about Ljubljana, filming it or creating other types of content about it, we have many useful resources for you. Read on for tips, statistics, news and other types of information.
-
Thursday
28°C -
Friday
29°C -
Saturday
30°C
What exactly is it about Ljubljana that everybody is talking about it? Well, where should we start? Perhaps its laid-back character? Or the buzzing culture scene? Is it the fantastic food? The green and sustainable ways of doing things? Or because it’s the perfect base for exploring the rest of Slovenia?
To get you started on your research, we put together a few resources that will explain some of the aspects of the Ljubljana way of life. For more information, contact us and we’ll be glad to help.
Contact